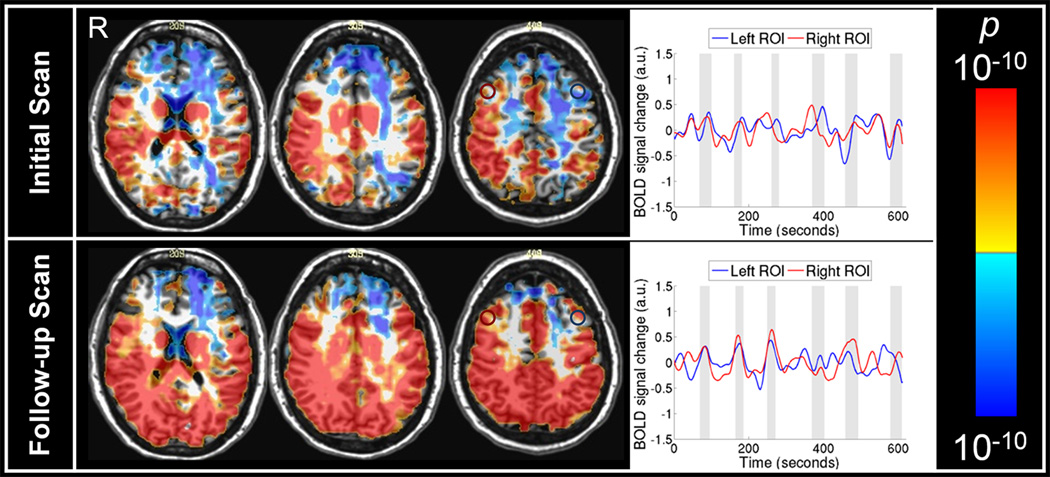
Figure 1.
Statistical parametric map of cerebrovascular reactivity (CVR) for a patient with mTBI at the initial scan two months post mTBI (upper panel) and the follow scan one year later (lower panel). Upper panel: Negative CVR indicated by cool colors was observed in both gray and white matter in the frontal and parietal areas, more on the left hemisphere, in the initial scan of the mTBI patient. MRI signal time series were extracted from the selected regions of interest in the left dorsolateral frontal area (blue circle) and in the right dorsolateral frontal area (red circle). The shaded columns in the time series plots indicate breath-hold epochs. The time series from the left medial parietal area was not in synchronous with the breath-hold epochs. Lower panel: Positive CVR indicated by warm colors was observed in the left parietal areas in the follow-up scan of the mTBI patient. The MRI signal time series from the tissues in left (blue circle) and right (red circle) dorsolateral frontal areas were in synchronous with the breath-hold epochs. a.u., arbitrary units.

