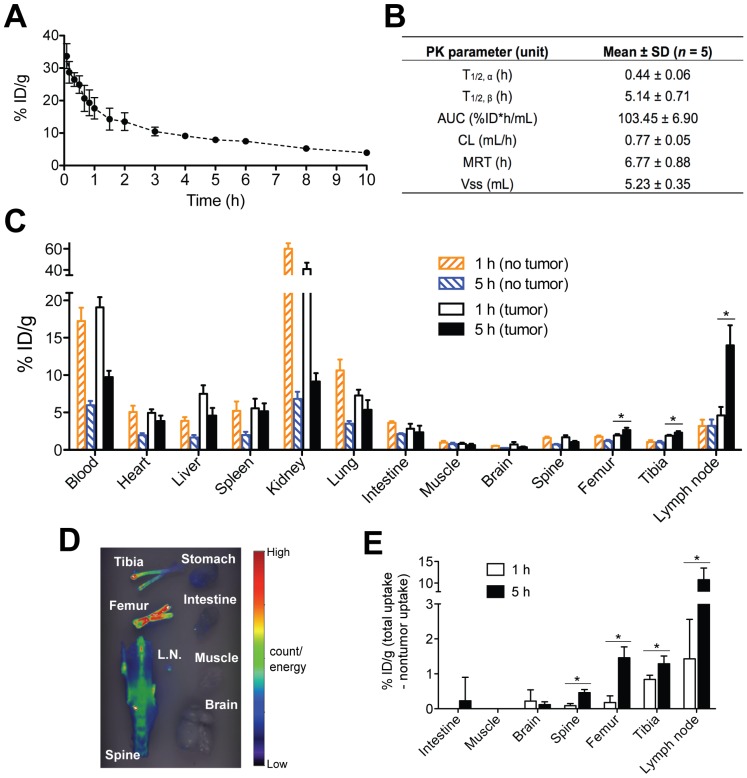
Fig 3.
Optimization of tumor pretargeting time lag by pharmacokinetics and biodistribution. (A) The blood radioactivity-time profile of 125I-labeled Fab'-MORF1 in healthy SCID mice (n = 5). The closed circles represent the mean radioactivity, expressed as the percentage of the injected dose per gram of blood (% ID/g). (B) Two-compartment plasma pharmacokinetic (PK) parameters of Fab'-MORF1 in mice. T1/2, α, initial half-life; T1/2, β, terminal half-life; AUC, total area under the blood concentration versus time curve; CL, total body clearance; MRT, mean residence time; Vss, steady-state volume of distribution. (C) Biodistribution of Fab'-MORF1 in healthy SCID mice (no tumor) and SCID mice bearing human B-cell lymphoma xenografts (n = 4 per group). Raji cells were injected from the tail vein of mice 7 days prior to the study. Mice were sacrificed at 1 h or 5 h after i.v. injection of 125I-Fab'-MORF1. (D) Fluorescence molecular tomography (FMT) analysis of lymphoma B-cells dissemination in mice. Four million Raji cells were stained with the DiR dye and injected via the tail vein to SCID mice (n = 4). At 24 h post-tumor inoculation, organs were harvested for ex vivo imaging. L.N., lymph node. (E) Tumor-specific uptake of Fab'-MORF1. Mean radioactivity in each organ of healthy mice (no tumor; n = 4) is defined as the background. Tumor-specific uptake was analyzed by subtracting the background from the radioactivity of corresponding organs of the tumor-bearing mice (n = 4 per group). Negative values are shown as zero. All data are presented as mean ± SD. Statistics was performed with student's t test of unpaired samples (*: p < 0.05).

