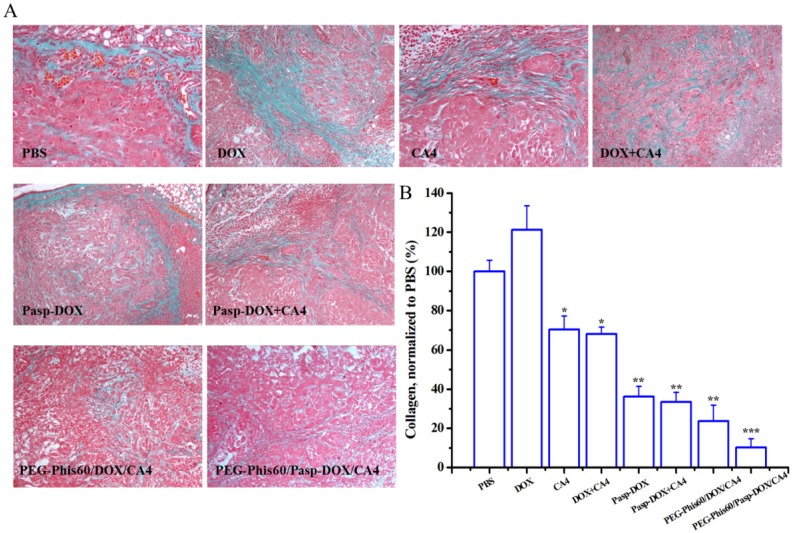
Figure 9.
(A) Tumor sections were stained with Masson Trichrome after treatment with different formulations. The blue color represented collagen content, and the cytoplasm was stained red. (B) The collagen content of five randomly selected microscopicfields after treatments was quantified using ImageJ. Results are shown as mean±S.D. (n=5). Statistical significance: *P<0.05, **P<0.005 and ***P<0.0005 versus control.

