
Figure 3.
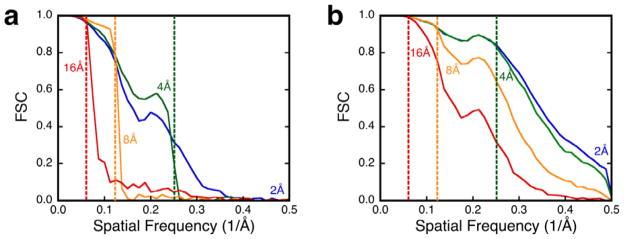
Resolution-limited alignment of proteinase K for SNR values of (a) 0.01 and (b) 0.1 show the difference between dominance of noise and alignable images. The dotted lines indicate the different resolution limits imposed: blue, 2 Å; green, 4 Å; orange, 8 Å; red, 16 Å. Images used: 104.