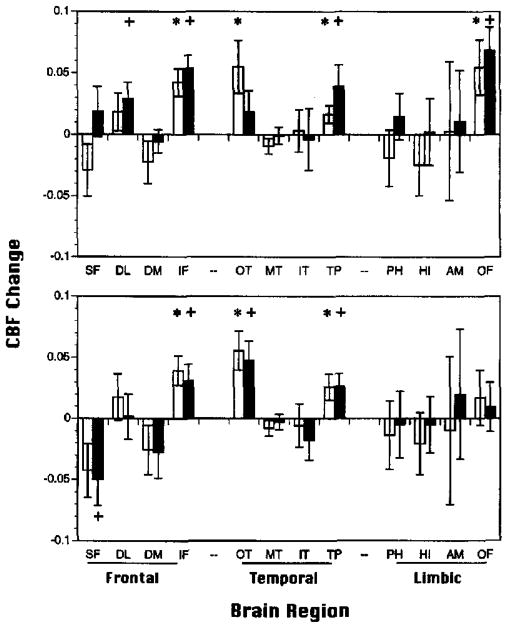
Figure 3.
Mean (±SEM) relative change in regional cerebral blood flow (rCBFΔ; baseline subtracted) for Paired Associate Recognition Test (PART; top graph) and Wisconsin Card Sorting Test (WCST; bottom graph) for 15 demographically matched controls (open bars) and 15 performance matched controls (shaded bars). SF = superior frontal; DL = dorsolateral prefrontal; DM = dorsomedial prefrontal; IF = inferior frontal; OT = occipitotemporal; MT = mid-temporal; IT = inferior temporal; TP = temporal pole; PH = parahippocampal gyrus; HI = hippocampus; AM = amygdala; OF = orbital frontal. *p < .05 demographically matched controls; +p < .05 performance-matched controls.

