
Figure 2.
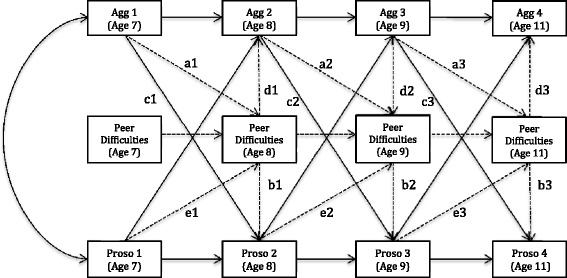
Autoregressive cross-lagged model of the association between prosocial behaviour and aggressive behaviour, including mediation by peer difficulties.
Note: Not displayed are pathways controlling for the effects of treatment as pictured in Figure 1 and residual correlations. All of these were estimated as described in the data analytic plan. The dotted lines represent the influences by peer difficulties; paths a1, a2, and a3 represent the influence of aggression at time t on peer difficulties at time t+1; paths b1, b2, and b3 represent the influence of peer difficulties at time t on prosocial behaviour at time t. Paths c1, c2, and c3 represent the direct influence of aggressive behaviour at time t on prosocial behaviour at time t+1.