
Figure 5.
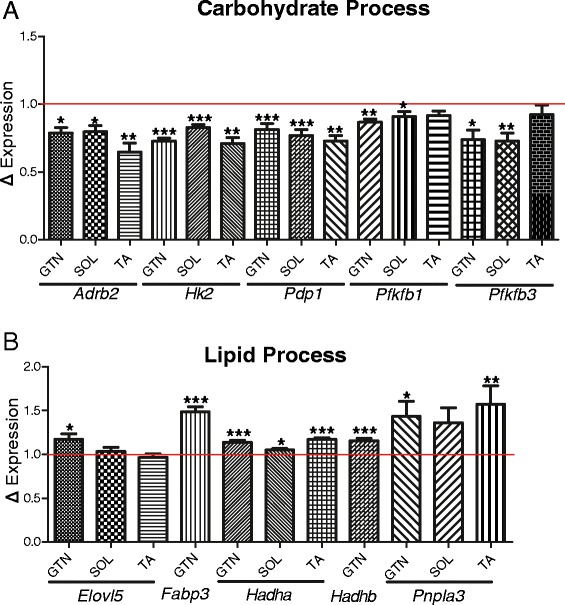
Differentially expressed circadian, metabolic genes in iMS-Bmal1−/− skeletal muscle. Average expression changes of the circadian carbohydrate (A) and lipid (B) genes in iMS-Bmal1−/− gastrocnemius averaged over circadian times 18, 22, 26, 30, 34, and 38. Tibialis anterior and soleus gene expression changes (Dyar et al.) averaged over circadian times 0, 4, 8, 12, 16, and 20. The red line denotes control (iMS-Bmal1 +/+) gene expression values. *P ≤ 0.05; **P ≤ 0.01; ***P ≤ 0.001.