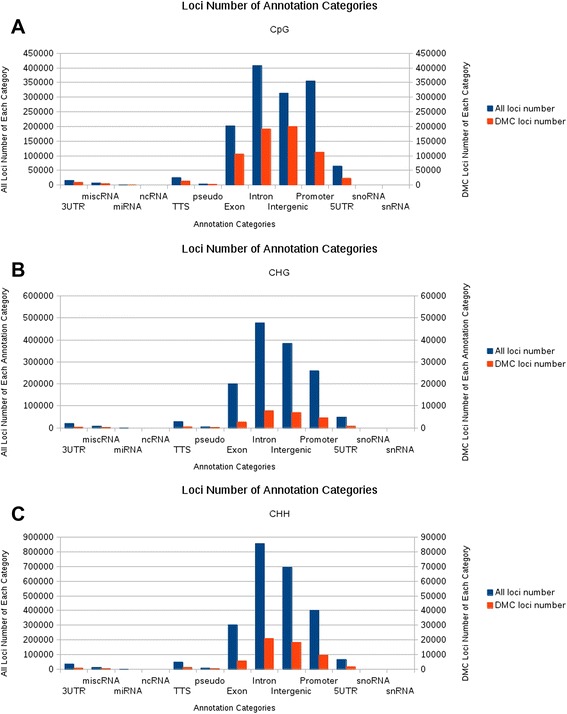
Figure 1.

The distribution of differentially methylated cytosines (DMCs) in different genomic components. A shows the distribution of total cytosines (blue bars) and DMCs (red bars) in the context of CpG in different components of the human genome. B and C show the distribution of total cytosines (blue bars) and DMCs (red bars) in the context of CHH and CHG in different components of the human genome, respectively. The height of the left vertical axis indicates the number of total cytosines in the context of CpG (A), CHG (B) and CHH (C), respectively. The height of the right vertical axis indicates the number of the DMCs in the context of CpG (A), CHG (B) and CHH (C) for the given genomic components, respectively.
