Figure 3.

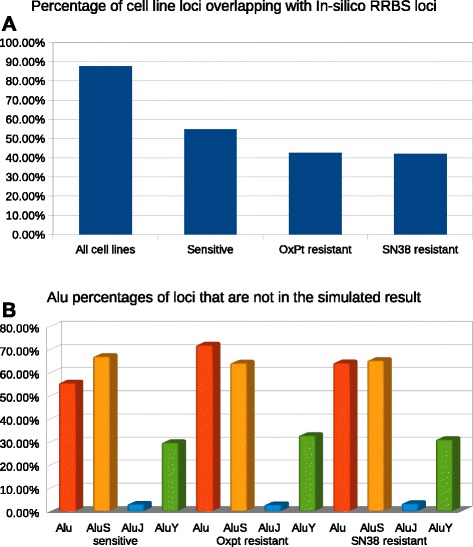
A shows the percentage of loci overlapping with the simulation in sets A, P, O and S. B shows the percentage of Alu elements, and Alu subfamilies in sets P, O and S, which are not overlapping with the simulation.

A shows the percentage of loci overlapping with the simulation in sets A, P, O and S. B shows the percentage of Alu elements, and Alu subfamilies in sets P, O and S, which are not overlapping with the simulation.