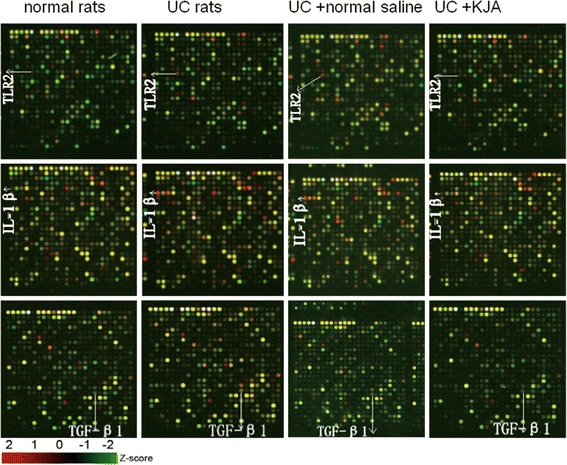
Fig. 2.

The effect of KJA on TLR2, IL-1β and TGF-β1 expression in colon tissues from rats. Representative microarray images of cDNA samples derived from different groups of rats are shown (n = 3). The arrows indicate the corresponding gene spots for TLR2, IL-1β and TGF-β1. Red color denotes an increase of gene expression, whereas green colored spots indicates a decrease
