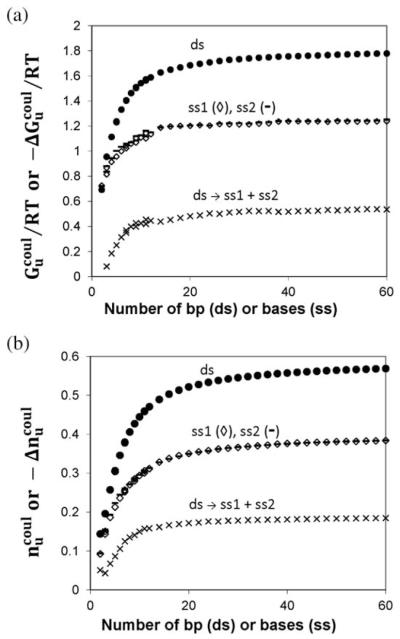
Fig. 6.
Length dependences of change in coulombic free energy () and salt ion association () in duplex melting transition. The per charge free energy (panel A) and salt ion association (panel B) both at 0.15 M concentration of 1 : 1 salt from all-atom calculations plotted as function of the number of bases (ss DNA oligomer) of base pairs (ds DNA oligomer). The change in free energy and in salt ion association calculated per charge of ds oligomer are plotted as function of the number of base pair.

