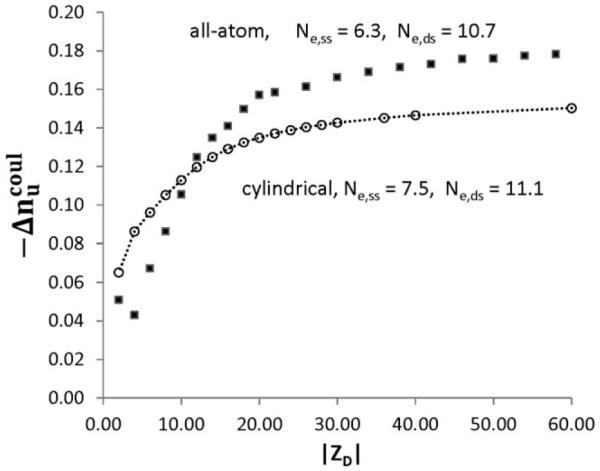
Fig. 7.

Comparison of per-charge change in salt ion association for duplex melting transition from all-atom and cylindrical models. All-atom (Fig. 6, symbols) and cylindrical model (Table 2, circles) predictions are plotted as a function of duplex charge. Calculations of for cylindrical model of ds and ss DNA are performed with radii ads = 9.4 Å, ass = 7 Å, and charge separations bds = 1.7 Å, bss = 3.4 Å.9
