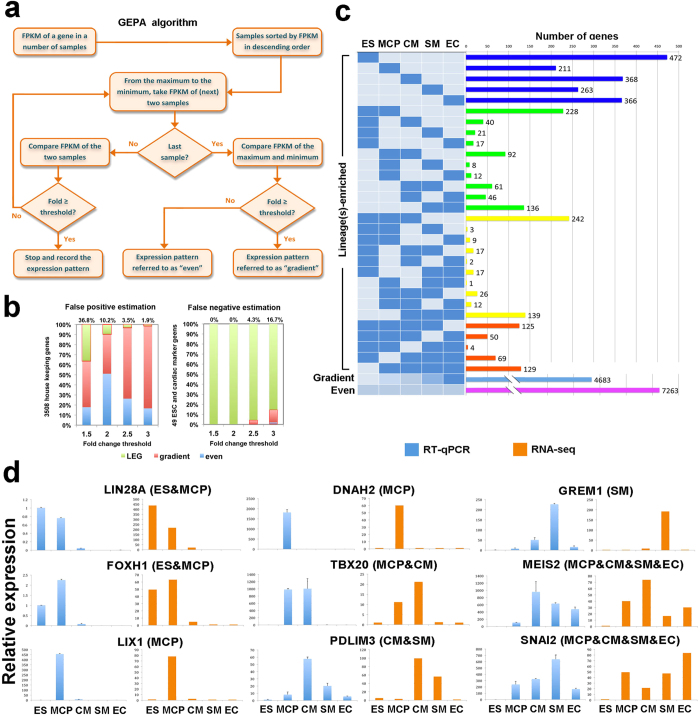
Figure 2.
GEPA algorithm identified lineage-enriched genes from RNA-seq data. (a) Schematic representation of the “GEPA” algorithm workflow to identify the lineage-enriched patterns of the genes. (b) Estimation of false positive and false negative ratio of GEPA algorithm at different thresholds of FPKM fold change. (c) Distribution of the genes across the expression pattern categories. Lineage-enriched patterns are indicated at left side. In the same row, rectangles filled with blue are at least 2.5 fold higher than those in light gray. The bars indicating the number of genes are color coded. Blue for single lineage-enriched groups. Green, yellow and orange for two, three and four lineage-enriched groups, respectively. Light blue for “Gradient” group and purple for “Even” group. (d) qRT-PCR validation of the signature genes for lineage-enriched categories. Gene name and expression pattern defined by GEPA (in brackets) were shown above the plots.

