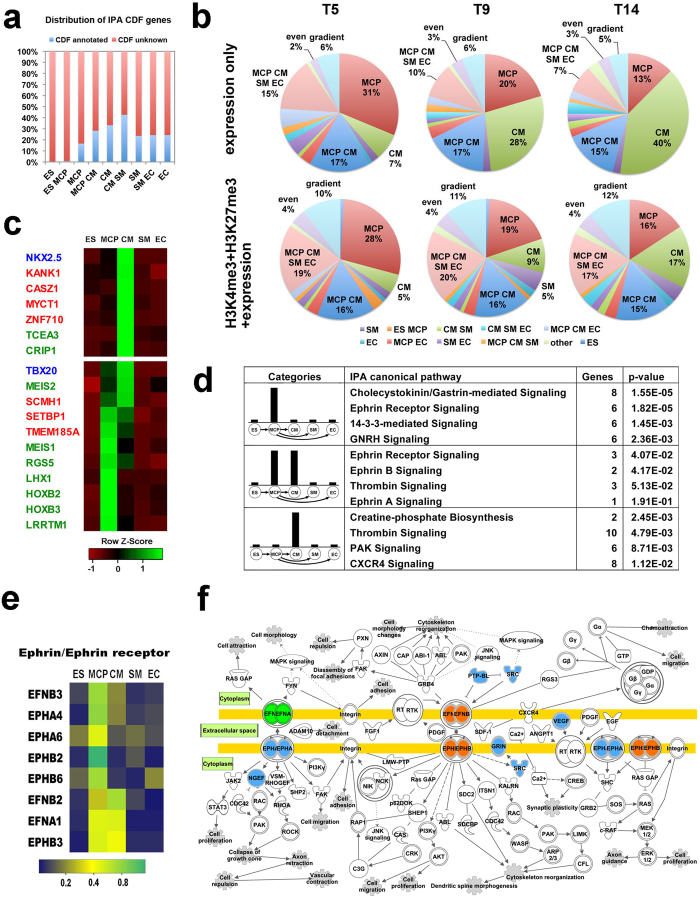
Figure 5.
LEGs identified by GEPA predict novel regulatory genes and pathways in human cardiovascular differentiation. (a) Percent of the genes with or without annotation in “cardiovascular development and function” from Ingenuity knowledge database in the LEG groups identified by GEPA. (b) Our GEPA analysis of top 100 novel cardiac regulatory genes previously predicted by Paige et al.13 when considering “expression only” or “H3K4me3+H3K27me3+expression “ at T5, T9 and T14 of CM differentiation, respectively. (c) Examples of predicted functional genes by GEPA. Dynamic expression of these genes is shown in heatmap. Known cardiac regulators are highlighted in blue. Our predicted candidates, which are overlapping with chromatin dynamics-based predictions by Paige et al. and Wamstad et al., are shown in green13,38. Novel regulatory genes solely predicted by GEPA are labeled in red. (d) Predicted novel regulatory pathways in cardiovascular differentiation using GEPA and Inginuity IPA pathway enrichment analysis. (e) A heat-map showing the lineage-specific expression pattern of ephrin and ephrin receptor genes during cardiovascular differentiation. To indicate the lineage-specificity, the relative gene expression was shown as percent in the sum of all the cell types in the heatmap. (f) Illustrative Ephrin/Ephrin signaling pathway imposed on a pathway map based on Ingenuity IPA showing localizations of the LEGs. Color code of the molecule indicates its lineage specificity. Blue indicates enrichment in “MCP” ; Orange, both “MCP” and “MCP&CM”; Green, “MCP&CM”.

