
Figure 1.
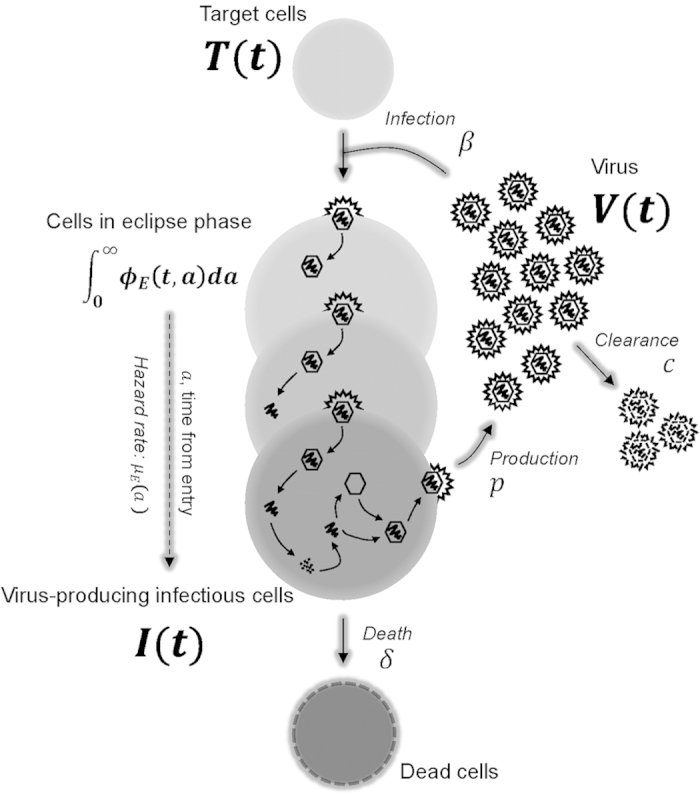
A schematic representation of the mathematical model. After a virion,  , successfully enters and infects a susceptible target cell,
  , at infection rate,
  , the newly infected cell progresses through different stages of cell populations,
  , which are structured according to the time elapsed,
  , since virus entry. Each of these stages has a corresponding age-dependent hazard rate,
  , for the probability that the newly infected cell in the eclipse phase transitions to the infectious state (i.e., becomes infectious,
  ) and begins virus production. An infectious, virus-producing cell,
  , produces progeny virions at constant rate
  , and dies at rate
  . The virions are cleared at rate
  .
.