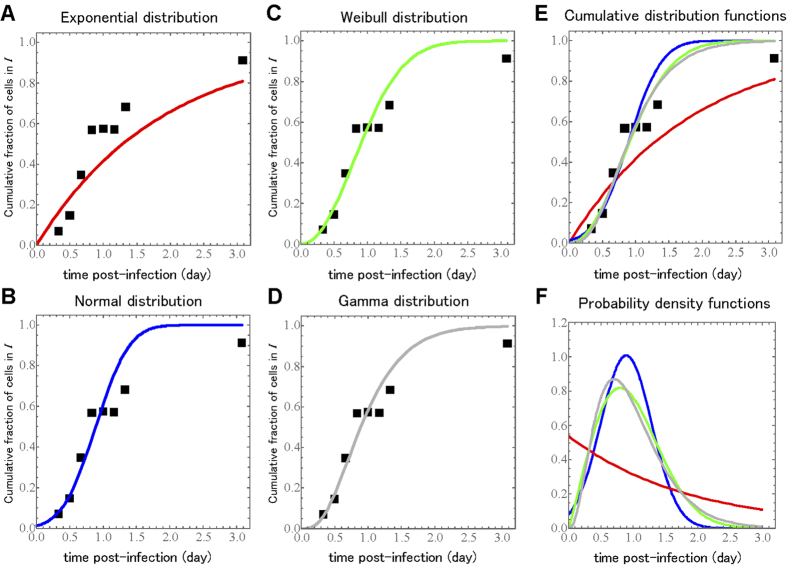
Figure 2.
Fits of several probability distributions to a single-cycle viral yield experiment. During the SC experiments at an MOI of 4.2 TCID50/cell, the ratio of Nef positive, infectious, virus-producing cells to total cells was measured over time. The symbols denote experimental time course data and the solid line displays the best fit of the cumulative distribution function for the (A) exponential, (B) normal, (C) Weibull and (D) gamma distributions to the experimental data. The overlaid (E) cumulative distribution functions and their associated (F) probability density functions are also shown for comparison.

