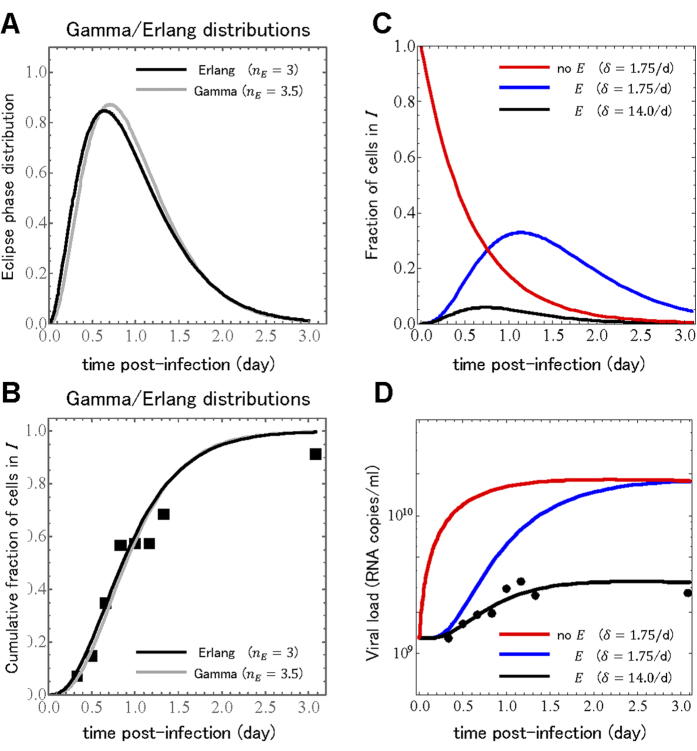
Figure 3.
Reconstruction of the single-cycle viral yield experiment. The (A) probability density function and (B) cumulative distribution function for our gamma distribution with a shape parameter of 3.5 and our Erlang distribution with a shape parameter of 3, both with a mean of 0.98 days are shown side-by-side for comparison. Prediction of the (C) fraction of infectious cells,  , and (D) extracellular viral load,
  , from the analytical expressions, Eqs. (21, 22). Using a typical model with no eclipse phase (no
  ) and a previously estimated infectious cell death rate of
  /d results in an incorrect prediction for the viral load time course. Using this same infectious cell death rate in Eqs.(21, 22) results a much larger fraction of cells infected and appearing much later compared to the model without an eclipse phase, and overestimates the viral load. Adjusting the infectious cell death rate to
  /d results in fewer infected cells peaking earlier, and agrees well with the experimental viral load.

