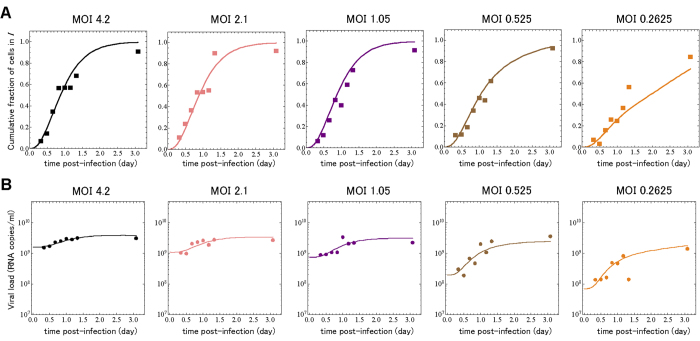
Figure 4.
Fits of mathematical model to single- and multiple-cycle viral yield experiment. During the SC and MC experiments at five different MOIs (TCID50/cell), the ratio of virus-producing cells to total cells and the amount of extracellular viral RNA in the supernatant were measured. The symbols denote the ratio of virus-producing cells in (A) and viral load in (B) respectively, and the solid lines are the best fit of the mathematical model, Eqs. (7)(10)(16, 17, 18, 19), to the data.

