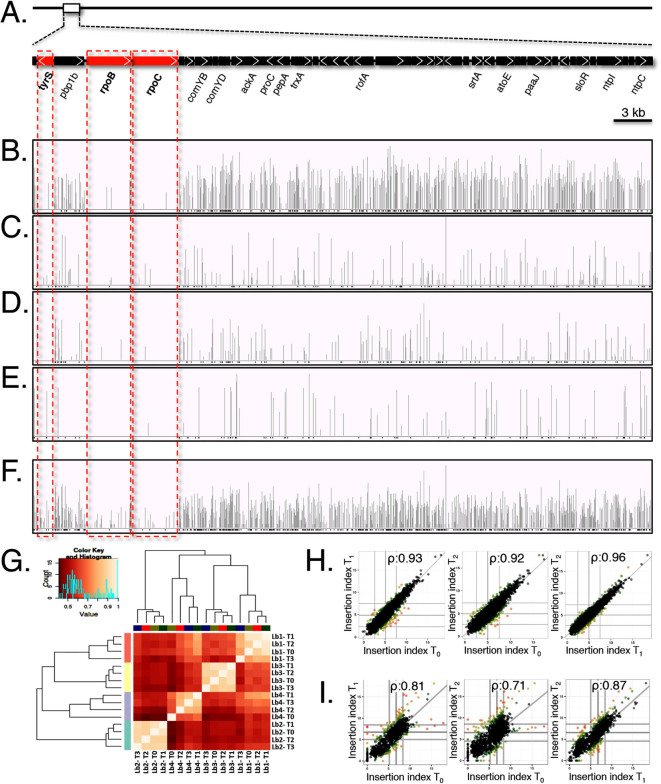
Figure 1. Comprehensive Krmit mutant libraries in GAS M1T1 5448 and M49 NZ131.
(A) Schematic of GAS M1T1 5448 chromosomal region from tyrS to ntpC. Genes that possess limited Krmit transposon insertion sites (TIS) determined by Tn-seq and Bayesian analysis are shown in red. Scale bar is indicated at right. (B to E) Location (horizontal axis) and depth (vertical axis) of all Krmit TIS identified within the 5448 genomic region in four independent mutant libraries as determined by Tn-seq at time point T0 presented using IGV. (F) Location and density of Krmit TIS in the “Master” M1T1 5448 library generated by merging the 4 independent libraries B-E. (G) Heat map summarizing the pairwise comparison of the four independent M1T1 5448 Krmit mutant libraries as determined by Tn-seq at each time point (T0, T1, T2 and T3; 16 total libraries) using Spearman’s rank correlation coefficients. Scatter plot summarizing the pairwise comparison of the Krmit TIS in the M1T1 5448 “Master” library (H) and the M49 NZ131 library (I) at different time points using Spearman’s rank correlation coefficients.

