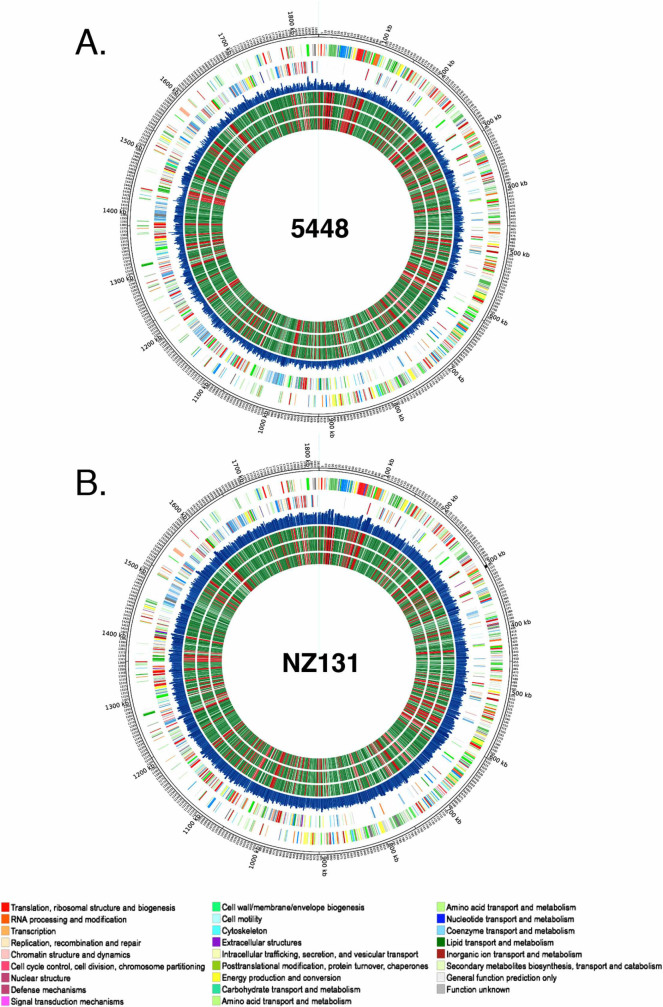
Figure 2. Bayesian prediction of gene essentiality in GAS M1T1 5448 and M49 NZ131 genomes at multiple time points.
Circos atlas representation of M1T1 5448 (A) and M49 NZ131 (B) genomes are shown with base pair (bp) ruler on outer ring. Next two outer circles represent GAS open reading frames on the (+) and (−) strands, respectively, with colors depicting COG categories (legend at bottom). The next circle (blue) indicates the frequency of Krmit TIS in each genome at T0. The inner three circles present the results of Bayesian analysis of GAS gene essentiality at time points T0, T1 and T2 in order towards center; with essential genes (EBay) in red, non-essential genes (NEBay) in green, and excluded genes in black.

