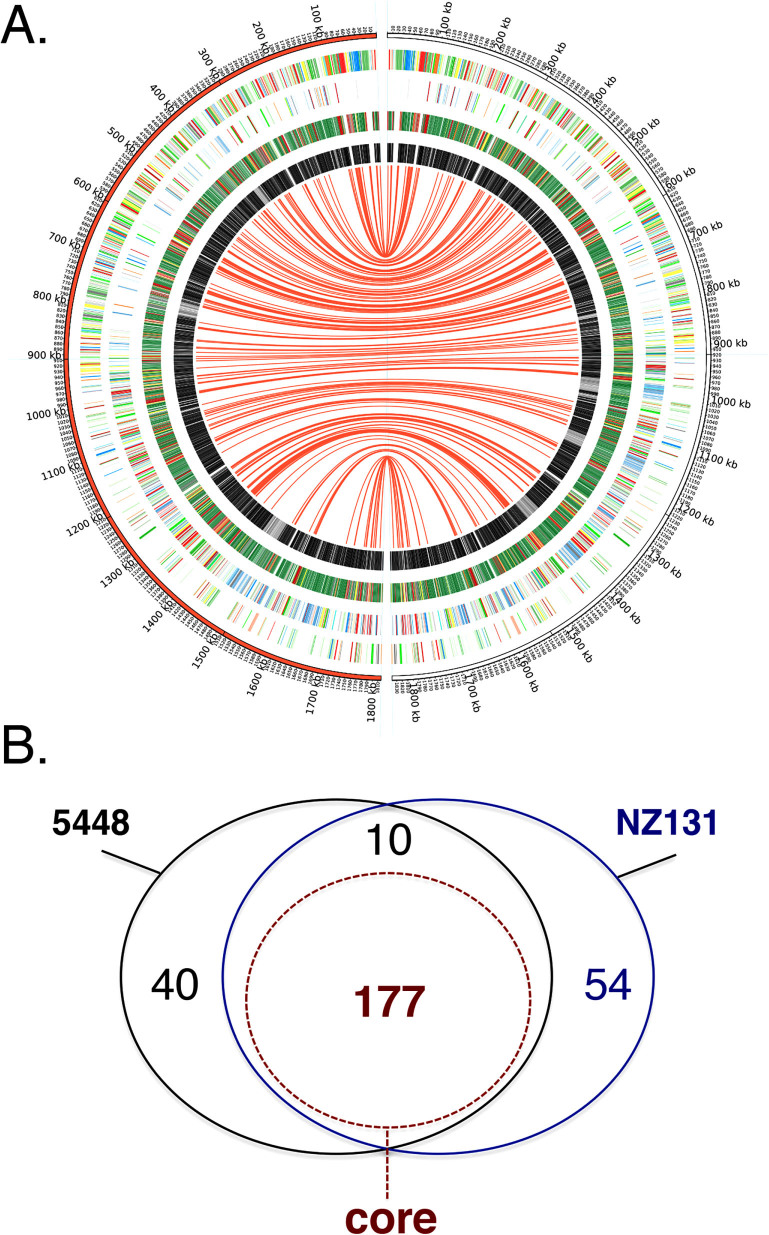
Figure 3. Conserved GAS gene essentiality based on integration of Bayesian analysis at all time points.
Bayesian prediction datasets at the time points T0, T1 and T2 were integrated for both M1T1 5448 and M49 NZ131 into the categories "essential", "critical", "non-essential", or "non-conclusive". (A) Circos atlas representation of M1T1 5448 (left, red semicircle) and M49 NZ131 (right, white semicircle) genomes are shown with base pair (bp) ruler on outer ring. Next two outer circles represent GAS open reading frames on the (+) and (−) strands, respectively, with colors depicting COG categories (see Fig. 2). The next circle presents the integrated analysis of GAS gene essentiality at all time points; with "essential" (red bars), "critical" (yellow bars), "non-essential" (green bars), and "non-conclusive" (black bars) genes indicated. Inner circle represents a genomic comparison between the M1T1 5448 and M49 NZ131 with homology (black) and non-homology (grey) shown. Red centerlines connect conserved "essential" genes shared between the two GAS genomes. (B) Venn diagram representing a comparison between the integrated "essential" genes found in GAS M1T1 5448 (227 genes, black) and M49 NZ131 (234 genes, blue) genomes. Shared "essential" genes also found within the GAS "core" genome (177 genes, see Fig. 4) are shown (dashed red line). See Table S7 for detailed list of genes.

