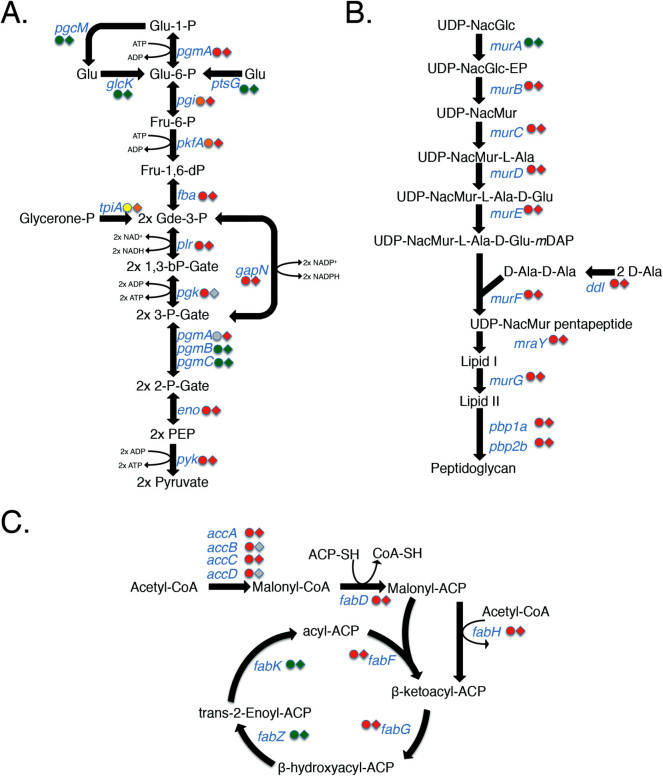
Figure 4. GAS essential genes correlate to key metabolic pathways and cellular functions.
Schematics of the pathways for (A) Glycolysis, (B) Peptidoglycan biosynthesis, and (C) Fatty acid biosynthesis are shown, including reactants/products (black font) and genes encoding key enzymes (blue font). Integrated Bayesian analysis results for key enzymes are shown for GAS 5448 (circles) and NZ131 (diamonds) with "essential" genes in red; "critical" genes in yellow; "non-essential" genes in green; and "non conclusive" genes in grey.

