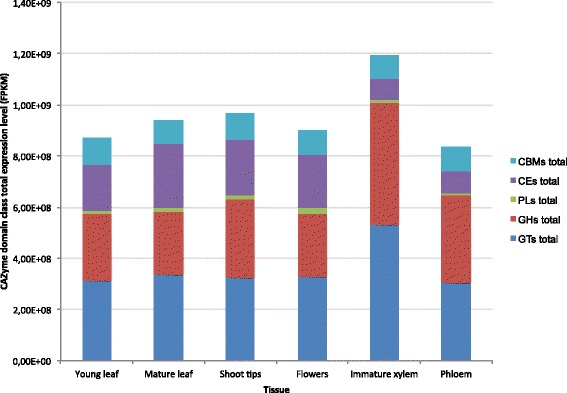
Figure 2.

Total gene expression levels of five CAZyme domain classes across six tissues in E. grandis. The y-axis represents the mRNA-Seq expression data in FPKM, and the x-axis the tissue type analyzed. The average expression data in FPKM for each gene can be found in Additional file 2.
