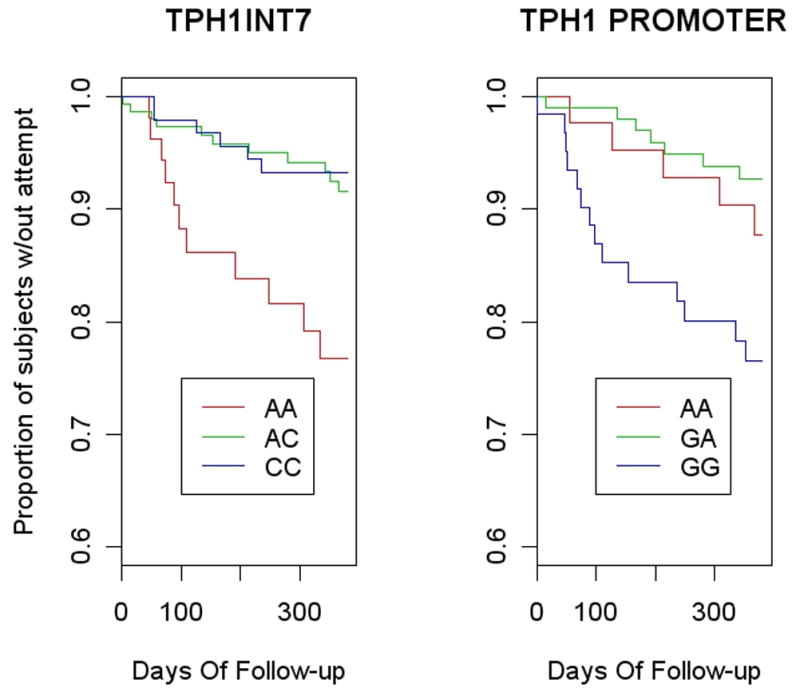
Figure 1.

Kaplan-Meier estimates of the survival curves for the three genotypes of A218C in intron 7 of TPH1 (Log-rank test p=.004) and for A-6526G on the promoter region (Log-rank test p=.009).

Kaplan-Meier estimates of the survival curves for the three genotypes of A218C in intron 7 of TPH1 (Log-rank test p=.004) and for A-6526G on the promoter region (Log-rank test p=.009).