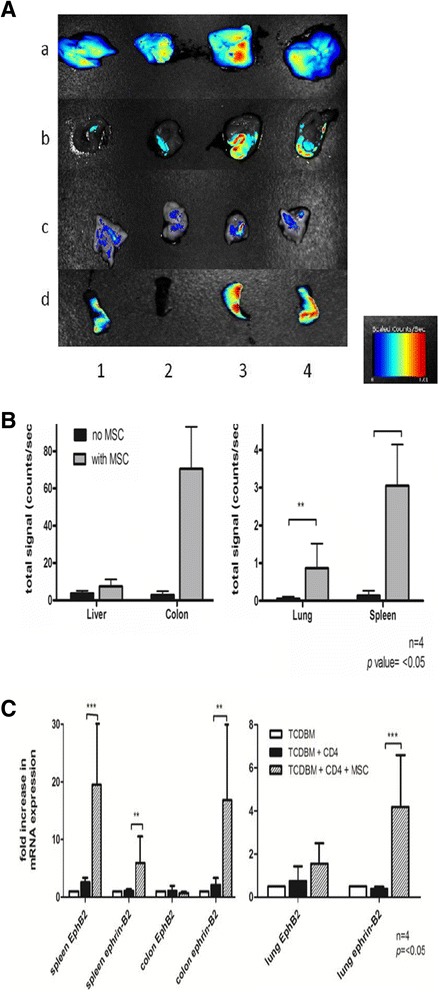
Figure 1.

Detection of hMSC homing capacity. (A-B) In vivo imaging of hMSCs in GVHD host tissues. (C) mRNA levels of EphB2 and ephrin-B2 in GVHD host tissues. Lethally irradiated BALB/c host mice were given intravenous injections of 2 × 10^6. TCDBM cells and 0.25 × 10^6 CD4+ T cells from C57BL/6 donors with or without 1 × 10^6 hMSCs. hMSCs are stained with CM-Dil prior to injection to host mice. (A) Fluorescent signals from host liver (a), colon (b), lung (c)and spleen (d) 6d after transplantation without (1,2) or with (3,4) cotransplantation of hMSCs. Color bar represents signal intensity code. (B) Quantification of the signals in the liver, colon, lung and spleen. (C) Expression of EphB2 and ephrin-B2 6d after transplantation in BALB/c host spleen, colon and lung was measured by real-time RT-qPCR. Data were combined from 2 independent experiments with 2 mice in each experiment (n = 4 *p<0.05).
