Figure 3.

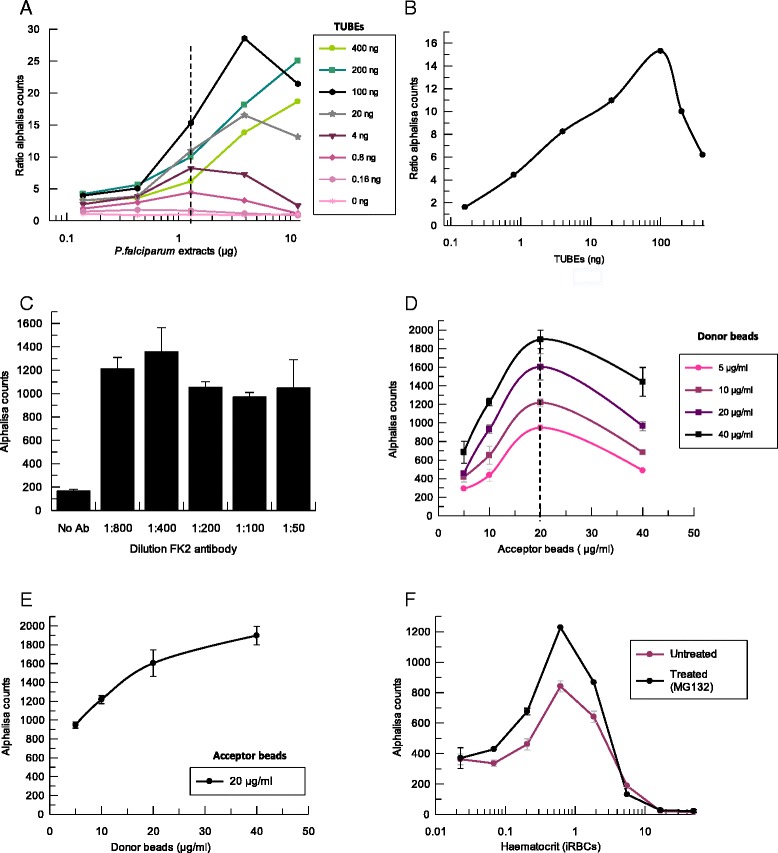
Optimization of the components of the AlphaLISA assay. Different panels show the titration of all the reagents. X axis of A, B and F panels are represented in logarithmic scale A. Cross titration of TUBEs and ubiquitylated proteins present in P. falciparum cell extracts, using 10 μg/mL of beads and 1:200 FK2 antibody dilution. Signal is represented as the ratio of AlphaLISA counts in presence an absence of TUBEs. B. Concentration curve of TUBEs at 1.3 μg of P. falciparum cell extracts. C. Titration of the anti-ubiquitin FK2 antibody with 100 ng TUBEs, 1.3 μg P. falciparum cell extracts and 10 μg/mL of beads. D. Cross titration of AlphaLISA donor and acceptor beads at conditions previously determined (100 ng TUBEs, 1:400 FK2 antibody and 1.3 μg of P. falciparum cell extracts). E. Titration of donor beads at 20 μg/mL of acceptor beads. F. iRBCs with schizonts at 100% parasitaemia and adjusted to different haematocrits with and without treatment of MG132.
