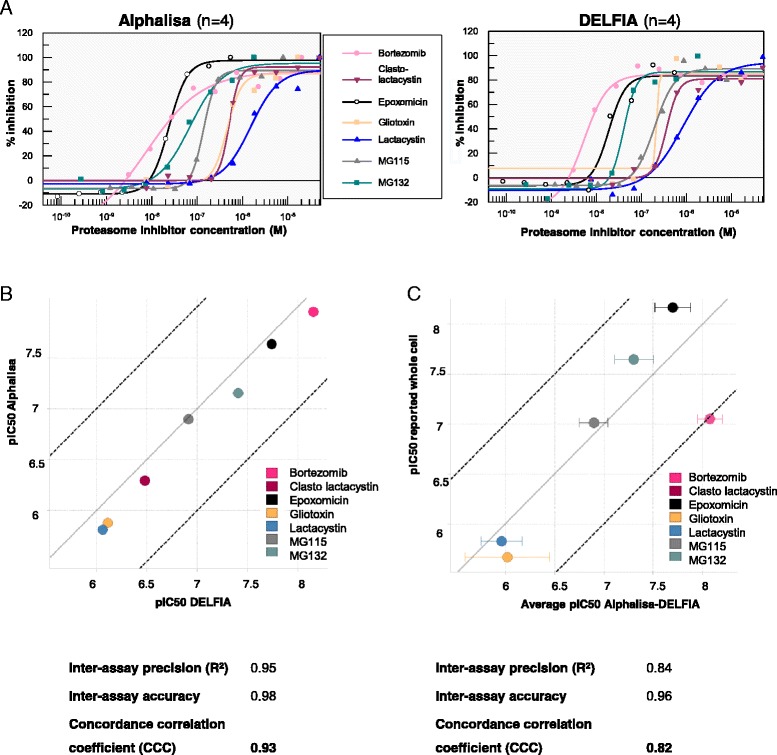
Figure 5.

Correlation between AlphaLISA and DELFIA assays. A. Dose–response curves of known proteasome inhibitors in TUBE-AlphaLISA (left panel) and TUBE-DELFIA assays (right panel). The response is represented as a percentage of inhibition, which is calculated normalizing the data to the maximal signal obtained for each compound (see data analysis section). B. Correlation of pIC50s in TUBE-AlphaLISA and TUBE-DELFIA assays (average of at least 2 copies). Each point corresponds to a particular proteasome inhibitor. Interassay accuracy, Pearson’s correlation and CCC (the multiplication of both values) are shown. Grey line represents perfect correlation (y = x) while black doted lines are the perfect correlation ± 1 log unit (y = x ± 1). C. Correlation of the average of pIC50 obtained in the AlphaLISA and DELFIA assays vs reported pIC50 that produce the parasite growth inhibition in the whole cell assay.
