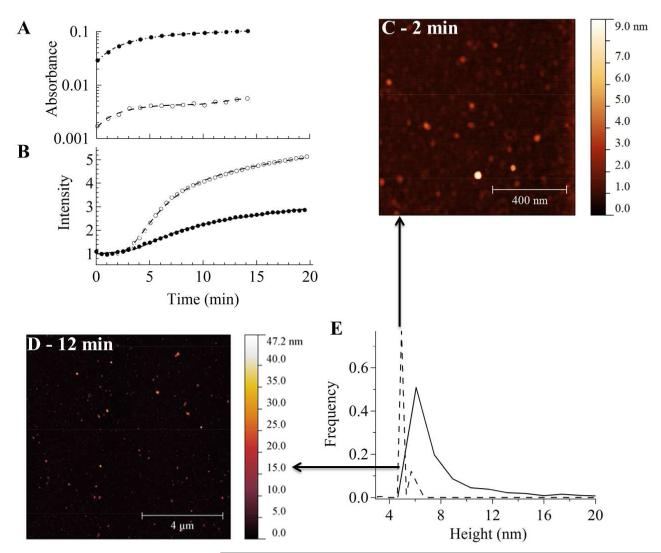
Figure 5.
This figure shows the early-time evolution of GNP growth measured by UV-vis, static light scattering, and AFM using 50 pM citrated ~ 23 nm seeds in aqueous precursor solutions containing L31(8 mM)/F68(4 mM) and ≈ 1 mM Au(III). (A) Absorbance (535 nm) and (B) scattering intensities (450 nm) for 0 (open circles) and 50 pM (closed circles) citrated seeded precursor solutions. The absorbance curves in (A) are fitted with an aggregative model: . For unseeded conditions the fits are: n = 1, k = (3.11 ± 0.60) × 10−1 min−1, tOR = (10.4 ± 0.8) min, A = (4.6 ± 0.2) × 10−3, B = (3.0 ± 0.2) × 10−3, C = (2.9 ± 0.8) × 10−4 min−1, w = 1 min−1. For seeded conditions (50 pM seeds) the fits are: n = 1, k = (2.10 ± 0.09) × 10−1 min−1, tOR = (11.5 ± 1.5) min, w = 1 min−1, A = (1.04 ± 0.02) × 10−1, B = (7.74 ± 0.12) × 10−2, C = (9.7 ± 6.5) × 10−4 min−1. For light scattering in (B), the curves are fitted with a combined RLCA and DLCA model: I(t) = y0 + y1e−y2t−2.1 + y3t , where y0 is constrained to unity. For unseeded conditions the fits are: y1 = 1.17 ± 0.06, y2 = 45 ± 0.2 min2.1, y3 = (4.3 ± 0.3) × 10−2 min−1. For seeded conditions (50 pM seeds) the fits are: y1 = 3.56 ± 0.57, y2 = 34 ± 1 min2.1, y3 = (3.8 ± 0.3) × 10−2 min−1. Representative AFM images (C) (512 × 512 pixels − 5 × 5 μ>m2) and (D) (1024 × 1024 pixels − 10 × 10 μ>m2) with height distributions (E) at 2 (dashed line; N = 265) and 12 (solid line; N = 912) minutes, respectively.

