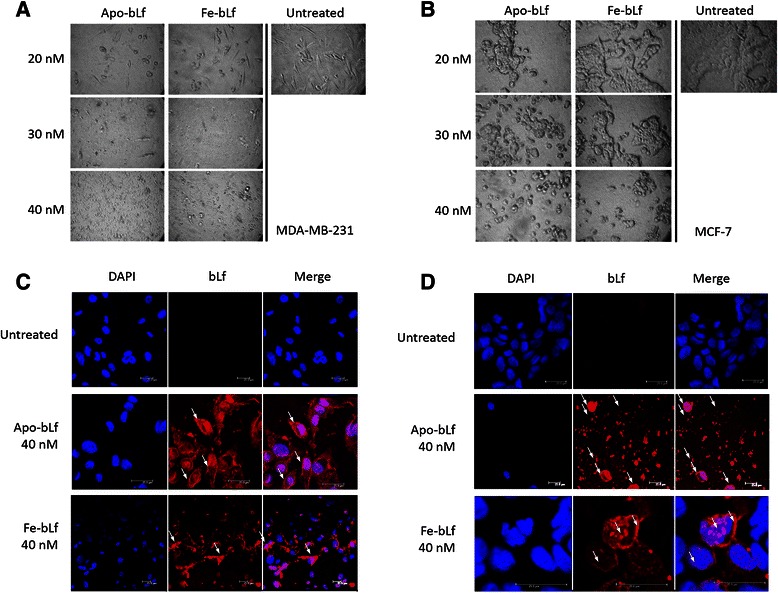
Fig. 2.

Cell morphology and internalization of bLf in MDA-MB-231 and MCF-7 cells. a MDA-MB-231 cells after 48 h treatments with both Apo-bLf and Fe-bLf at concentrations of 20, 30 and 40 nM as well as untreated cells. b MCF-7 cells after 48 h treatments with both Apo-bLf and Fe-bLf at concentrations of 20, 30 and 40 nM as well as untreated cells. All images at 400X magnification. Confocal microscope images displaying internalisation of 40 nM Apo-bLf and Fe-bLf in both MDA-MB-231 (c) and MCF-7 (d) cells after 4 h. Arrows indicate regions on the membrane, cytoplasm and nucleus where bLf has internalised. Cells stained with DAPI nuclear stain (blue) and immunolabelled with anti-bovine lactoferrin antibody followed by Alexa-Fluor TRITC conjugated secondary antibody (red). Scale bars indicate 25 μm
