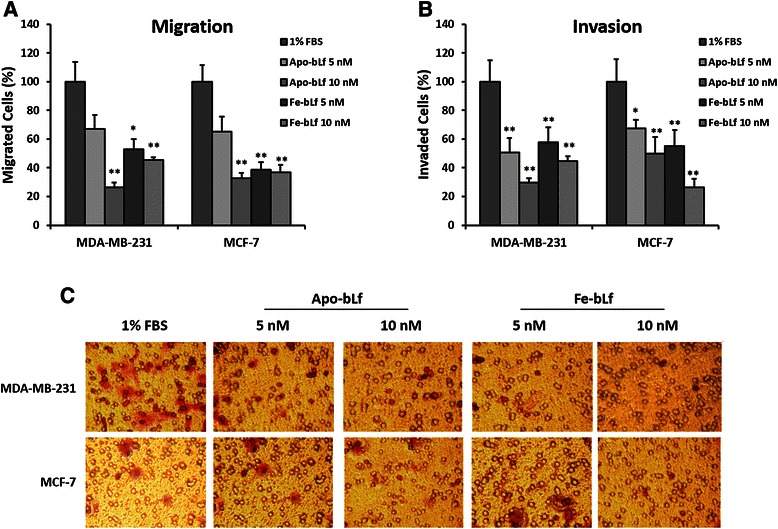
Fig. 3.

Effect on migration and invasion capacity of MDA-MB-231 and MCF-7 cells after treatment with bLf. Migration of MDA-MB-231 and MCF-7 (a) cells after bLf treatments for 24 h represented as a percentage of untreated (1% FBS) control migration. Invasion of MDA-MB-231 and MCF-7 cells (b) after bLf treatments for 24 h represented as a percentage of untreated (1% FBS) control invasion. * = p < 0.05 compared with 1% FBS group. Representative images (250X magnification) of invaded cells stained with crystal violet (c)
