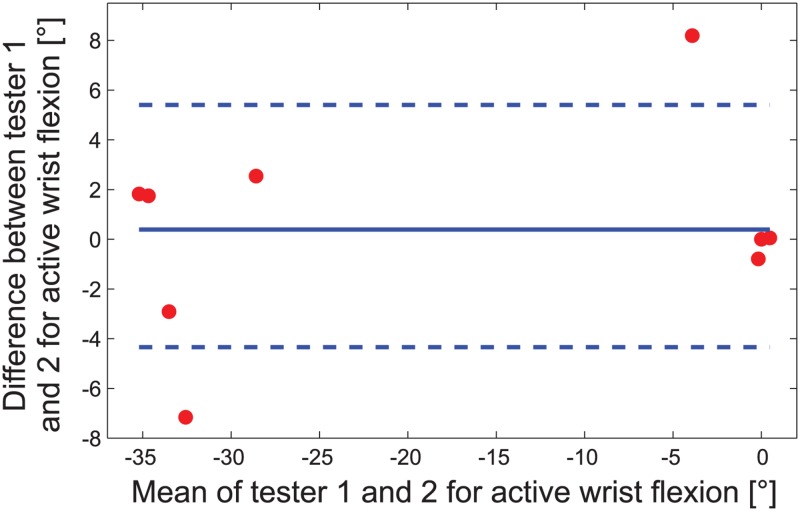
Fig 4. Example of an aROM Bland-Altman plot regarding wrist flexion for the nine patient arms.
The limits of agreement (dashed lines for lower -4.3° and upper 5.4° limit) and the mean difference (solid line at 0.5°) are shown. The x-axis shows the mean values of the two measurements of tester 1 and 2 (negative values indicate flexion, positive values stand for extension), while the y-axis shows the measurement difference between tester 1 and 2.

