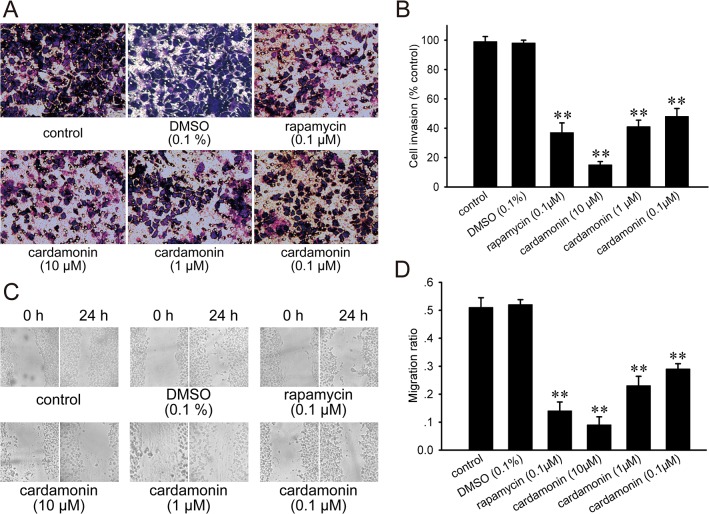
Fig 3. Cardamonin inhibited the invasion and migration of LLC cells.
After incubation with different drugs for 24 h, the cells in the top on the chamber were removed. (A) The cells that had migrated onto the bottom of the chamber were stained with crystal violet and photographed at 200 × magnification. (B) The invaded cells were counted, and the invasive ratio for each group was presented by comparing to the control group. The percentage of the penetrated cells for each group was showed as the bar graph. In the migration assay, a wound was inflicted in the cell layer, and then treated with different drugs for 24 h. (C) The denuded zone was photographed at 100 × magnification. (D) The traveled distance of the different treatment group was expressed as a ratio to the original distance. The migration ratio of each group was showed as the bar graph. The data were presented as the mean ± SD (n = 5). **p < 0.01, compared to the control group.

