
Fig 3. Joint distribution of monaural phases.
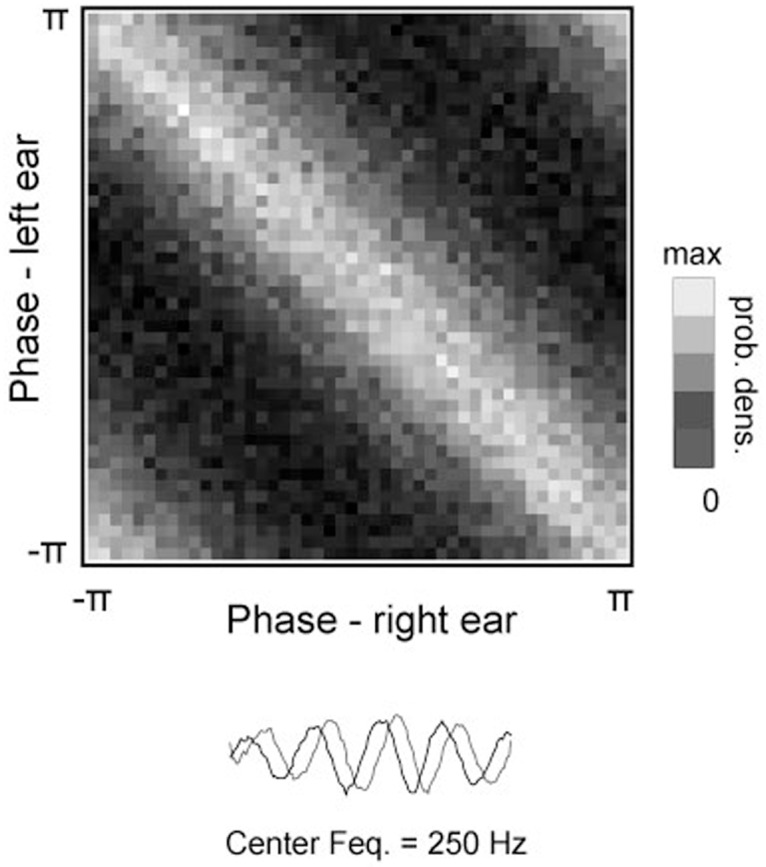
The distribution was estimated by independently encoding left and right ear sounds from an ensemble of binaural sound epochs and creating a histogram of phase values associated with the basis function depicted at the bottom of the figure. Visible ridge-like pattern implies that monaural phases reveal a dependence in their difference.