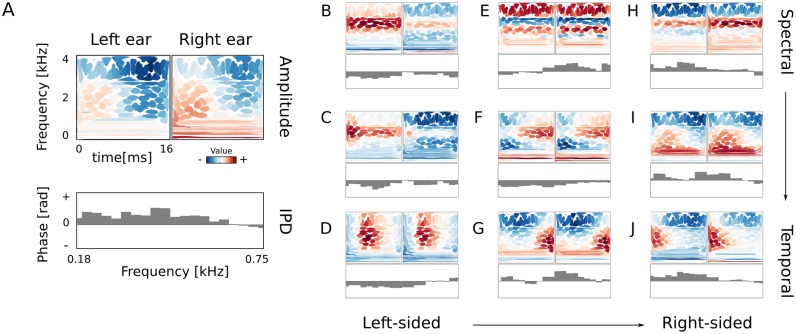
Fig 4. Higher-order basis functions.
A) Explanation of the visualization of second layer basis functions. Top two panels depict the binaural amplitude basis function B i. Spectrotemporal information in each ear is represented using isoprobability contours of Wigner-Ville distributions of first-layer basis functions (see Fig 2). Colors correspond to the log-amplitude weight. The bottom panel represents the IPD basis function ξ i. Each gray bar represents one of 20 selected low-layer basis functions. Here almost all values are positive (the bars point upwards), which corresponds to the right-ear precedence. B)-J) Basis functions ordered vertically by spectral modulation and horizontally by the dominating side.

