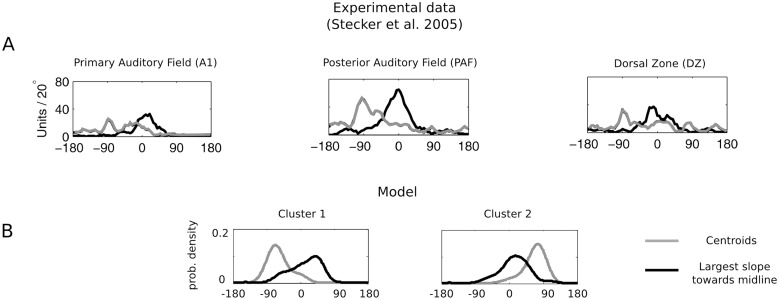
Fig 8. Distribution of tuning curve centroids and maximal slope positions in the model and experimental data.
A) Histograms of positions of tuning curve centroids (gray) and maximal slopes towards the midline (black) measured experimentally in the auditory cortical areas from the cat. Figure modified from [8]. B) Distribution of the same features computed for model tuning curves belonging to each cluster.

