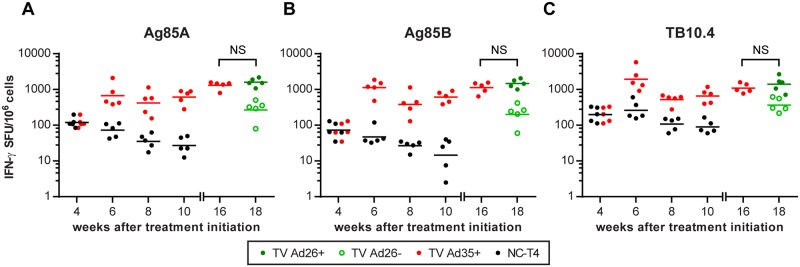
Fig 2. Immunogenicity of Ad35-TBS and Ad26-TBS immunotherapy.

At week 4, baseline IFN-γ production to pooled peptides covering the whole sequence of Ag85A, Ag85B and TB10.4 were measured by ELISpot prior to randomization (refer to Fig 1). At this time point, the values between the NC-T4 and TV Ad35+ are identical. Following randomization, animals in the TV Ad35+ group received immunotherapy at weeks 4 and 8 with 1010 viral particles of Ad35-TBS intramuscularly. At week 16, baseline immune responses were measured in the TV Ad35+ group prior to randomization into TV Ad26+ and TV Ad26- groups. The TV Ad26+ animals then received heterologous boosting with 1010 viral particles of Ad26-TBS at week 16 whilst the TV Ad26- received empty Ad26 vector as control. p-values were calculated two weeks after each immunotherapy (weeks 6 and 10) and are detailed in Table 2 (ANOVA followed by Tukey’s multiple comparisons test, n = 5 at each time point for all groups). Lines depict geometric mean. No significant differences were observed following Ad26-TBS boosting at week 16 for all groups (NS = not significant, t-test). SFU = splenocyte forming units.
