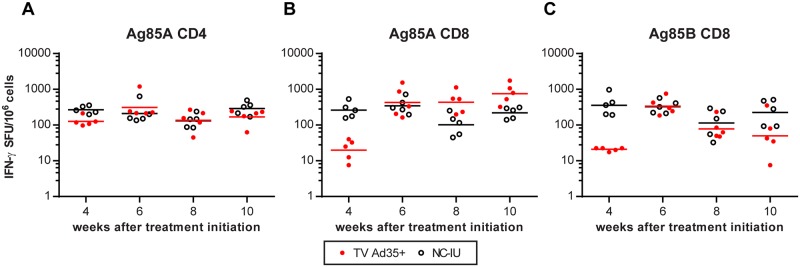
Fig 4. Comparison of T-cell responses between animals receiving immunotherapy and chronically infected untreated animals.

ELISpot assay was conducted to measure IFN-γ production in the TV Ad35+ and NC-IU animals following stimulation with A) CD4 peptide antigen to Ag85A B) CD8 peptide antigens to Ag85A and C) CD8 peptide antigens to Ag85B. Mice in the TV Ad35+ group received immunotherapy via intramuscular injection with 1010 viral particles of Ad35-TBS at weeks 4 and 8. Lines depict geometric mean and p-values were calculated using ANOVA followed by Tukey’s multiple comparisons test (n = 5 at each time point for all groups) and are detailed in Table 2. SFU = splenocyte forming units.
