
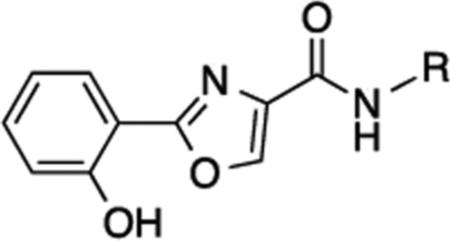
Table 1.
Selected HDAC % inhibition data for compounds 9-24.a
| |||||
|---|---|---|---|---|---|
| R | HUAC 1 | HUAC 2 | HUAC 6 | HDAC 10 | |
| 9 |
|
63 | 30 | 50 | 49 |
| 10 |
|
61 | 54 | 62 | 47 |
| 11 |
|
44 | 35 | 49 | 36 |
| 12 |
|
36 | 29 | 48 | 70 |
| 13 |
|
62 | 32 | 46 | 59 |
| 14 |
|
61 | 52 | 48 | 49 |
| 15 |
|
48 | 45 | 40 | 45 |
| 16 |
|
42 | 36 | 31 | 45 |
| 17 |
|
35 | 25 | 46 | 32 |
| 18 |
|
27 | 0 | 27 | 57 |
| 19 |
|
43 | 1 | 50 | 91 |
| 10 |
|
32 | 19 | 21 | 76 |
| 21 |
|
-- | -- | -- | -- |
| 22 |
|
70 | 57 | 60 | 47 |
| 23 |
|
47 | 41 | 31 | 56 |
| 24 |
|
26 | 32 | 60 | 55 |
a
Data shown was determined at a 20 μM concentration of each compound. Data points are the average of 3 determinations that in each case differed by 5% or less. Compound 21 was insoluble.