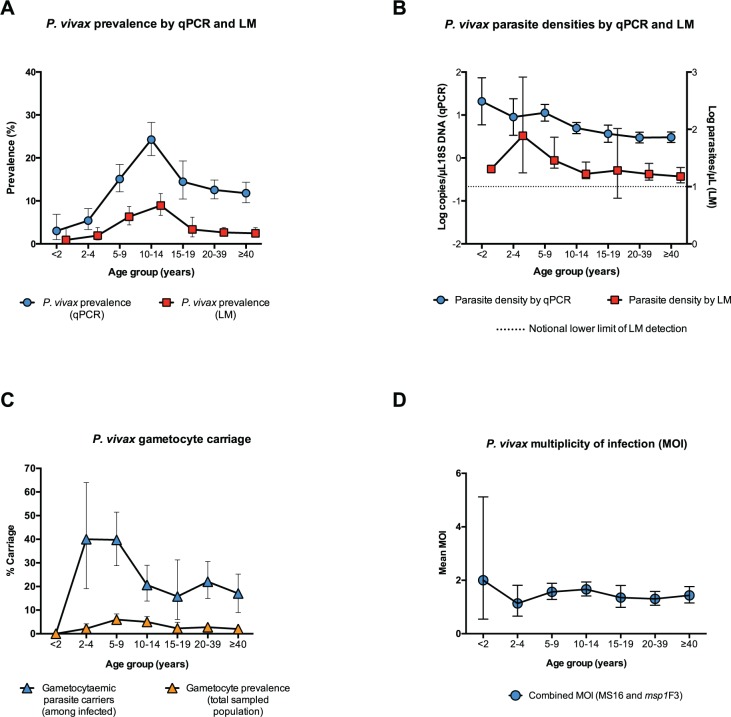
Fig 2. Age trends of P. vivax infections.
A: P. vivax blood stage parasite prevalence by LM and qPCR (error bars represent binomial 95% confidence intervals, CI95). B: P. vivax parasite densities by qPCR (18S DNA copies/l) and LM counts (parasites/l) (error bars represent 95% confidence intervals, CI95). C: Gametocyte prevalence (in the total sampled population) and positivity (only among P. vivax infected) (error bars represent 95% confidence intervals, CI95). D: P. vivax multiplicity of infection (MOI) of blood stage parasites (error bars represent 95% confidence intervals, CI95).

