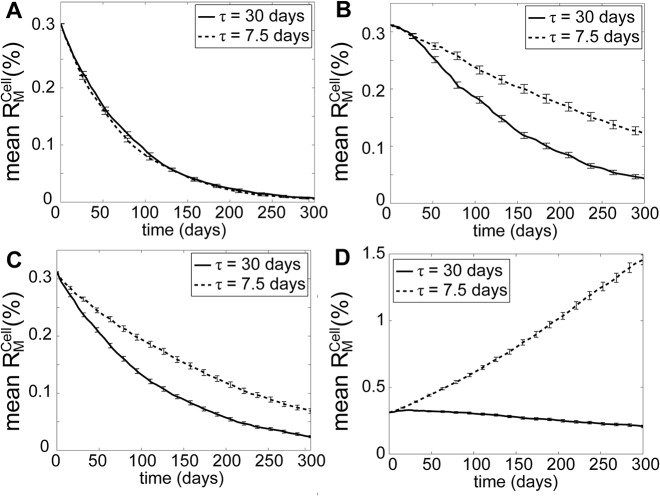
Fig 3. Model simulations with and without selectivity in mitochondrial fusion.
(A & B) Model simulations under two different mixing time constants (τ = 7.5 and 30 days) for (A) mutations without RA and (B) mutations with RA (k R = 2). (C & D) Model simulations of non-selective fusion for (C) mutations without RA and (D) with RA. The error bars represent the standard deviation of among 10,000 cells.

