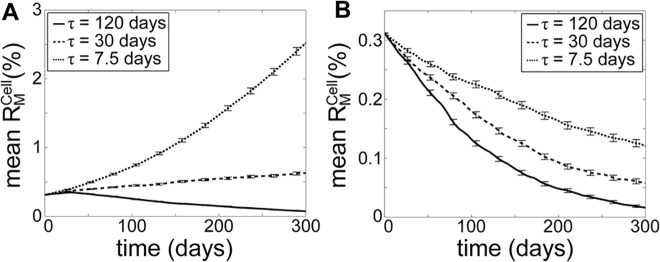
Fig 6. Effects of lower selectivity of mitochondrial fusion and mitophagy.

Model simulations were performed by lowering the mitophagy selectivity (r D,max) and fusion selecitivity (r fusi,max) to half (50%) of the nominal values, for mutant mtDNA molecules (A) with RA (k R = 2) and (B) without RA. The error bars show the standard deviation of among 10,000 cells.
