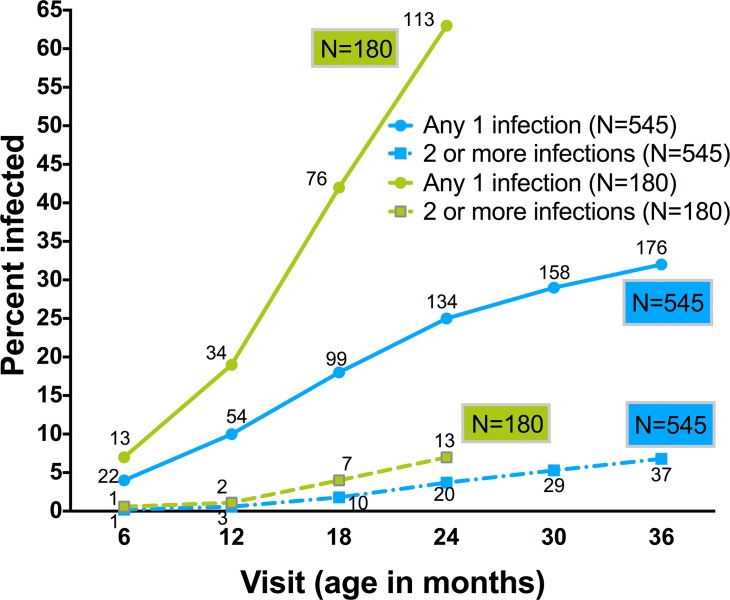
Fig 2. Cumulative incidence of parasitic infections.
Shown are rates of any parasitic infection (solid lines with circles) or of >1 (multiple) parasitic infections (dashed lines with squares) by the age of each study visit during the first 36 months of life for the total study cohort (N = 545), and for the first 24 months of life for the full follow-up cohort (N = 180). The number of children infected at each time point is indicated near the marker.

