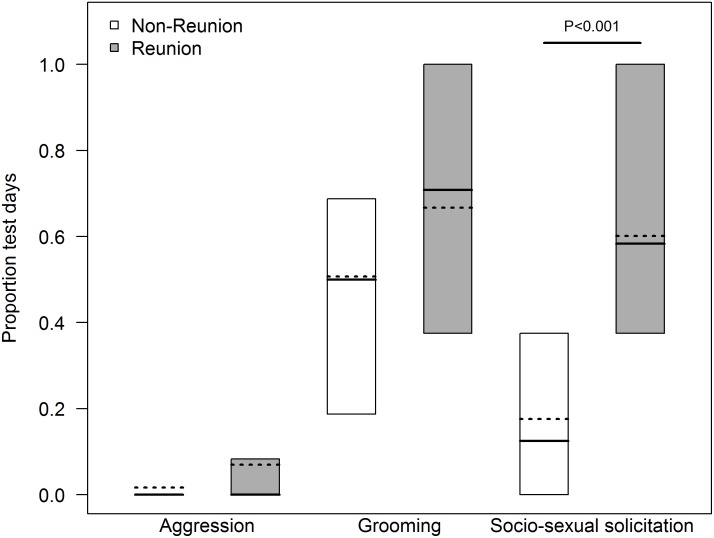
Fig 1. Proportion of non-reunion and reunion days during which aggression, grooming and socio-sexual solicitations occurred between pairs.
Box plots indicate medians and 25–75% inter-quartile ranges. Dashed lines indicate the expected values on non-reunion and reunion days based on the corresponding model.

