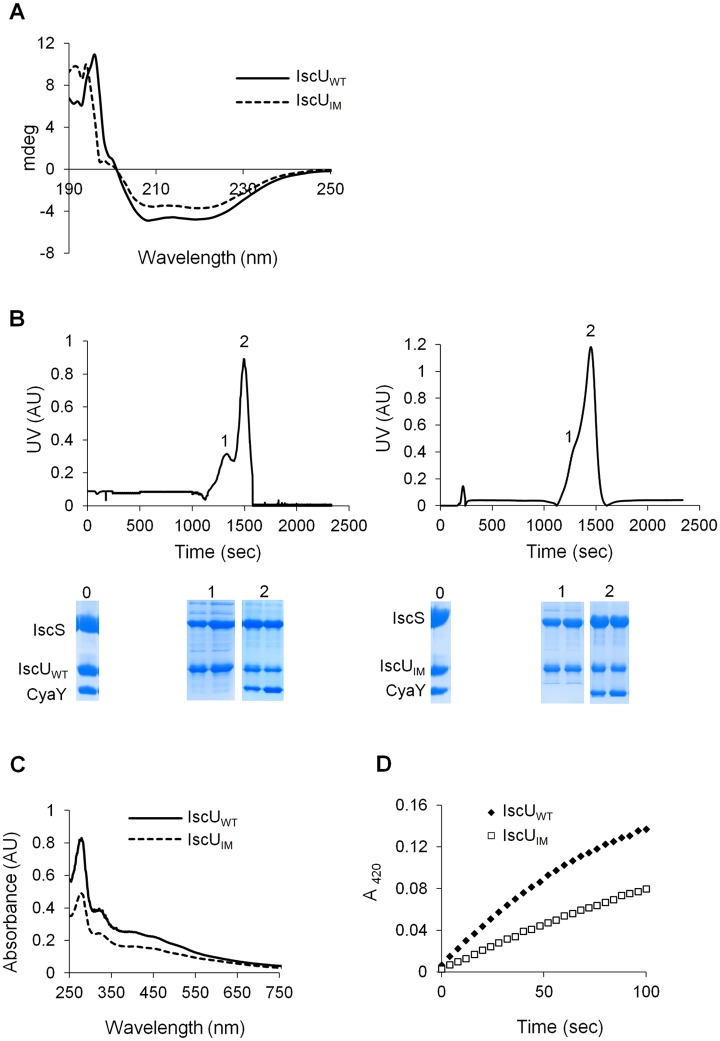
Fig 5. Analysis of IscUIM in vitro.
(A) Comparison of the CD spectra (expressed in mdeg) recorded in the region 190–250 nm between IscUWT (filled line) and IscUIM (dotted line). (B) Purified IscS, CyaY and IscUWT (left panel) or IscUIM (right panel) were mixed in 1:1:1 ratio (144 μM of each protein) in the presence of 4-fold excess of Fe(SO4)2(NH4)2, 10-fold excess of L-cysteine and 5 mM DTT and incubated for 40 minutes. The mixture was then loaded onto a QFF column equilibrated with 50 mM Tris pH 8. Proteins were eluted with 50 mM Tris pH 8 containing 1M NaCl. SDS-PAGE analyses have been performed on samples from the column on-put (0) and the peaks 1 and 2 for each mixture. (C) Reconstitution of [2Fe-2S] IscUWT (filled line) and IscUIM (dotted line) followed by UV-visible absorption spectroscopy. Apo-IscUWT or apo-IscUIM (144 μM) were incubated with 5 mM DTT, 1.44 μM IscS, 2 mM L-cysteine and 0.43 mM Fe(SO4)2(NH4)2 in 50 mM Tris-HCl pH 8. (D) Comparison of the kinetics of enzymatic Fe-S cluster formation on IscUWT (black diamonds) and IscUIM (white squares). Experiment was carried out using 25 μM IscUWT or IscUIM, 25 μM IscS, 100 μM Fe(SO4)2(NH4)2, 250 μM L-cysteine, 2 mM DTT. Fe-S cluster formation was followed by absorbance at 420 nm. The experiment was repeated at least three times. One representative experiment is shown.

