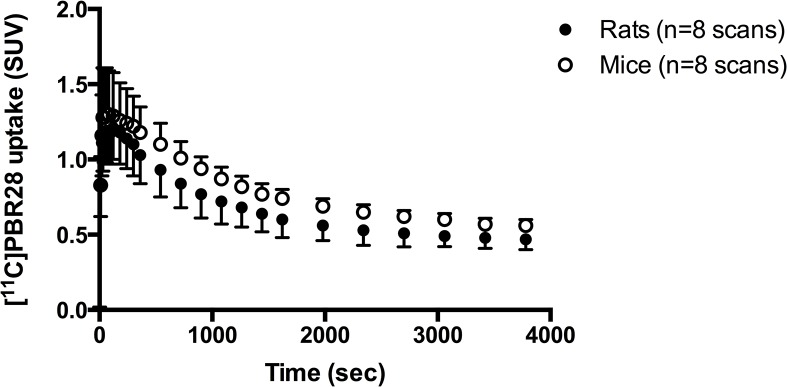
Fig 2. Total brain time-activity curves of [11C]PBR28 for rats and mice (SUV).

The time-activity curves represent the average uptake of the eight scans that were performed in both four rats and mice for the test-retest part of study, in which no arterial sampling was performed.
