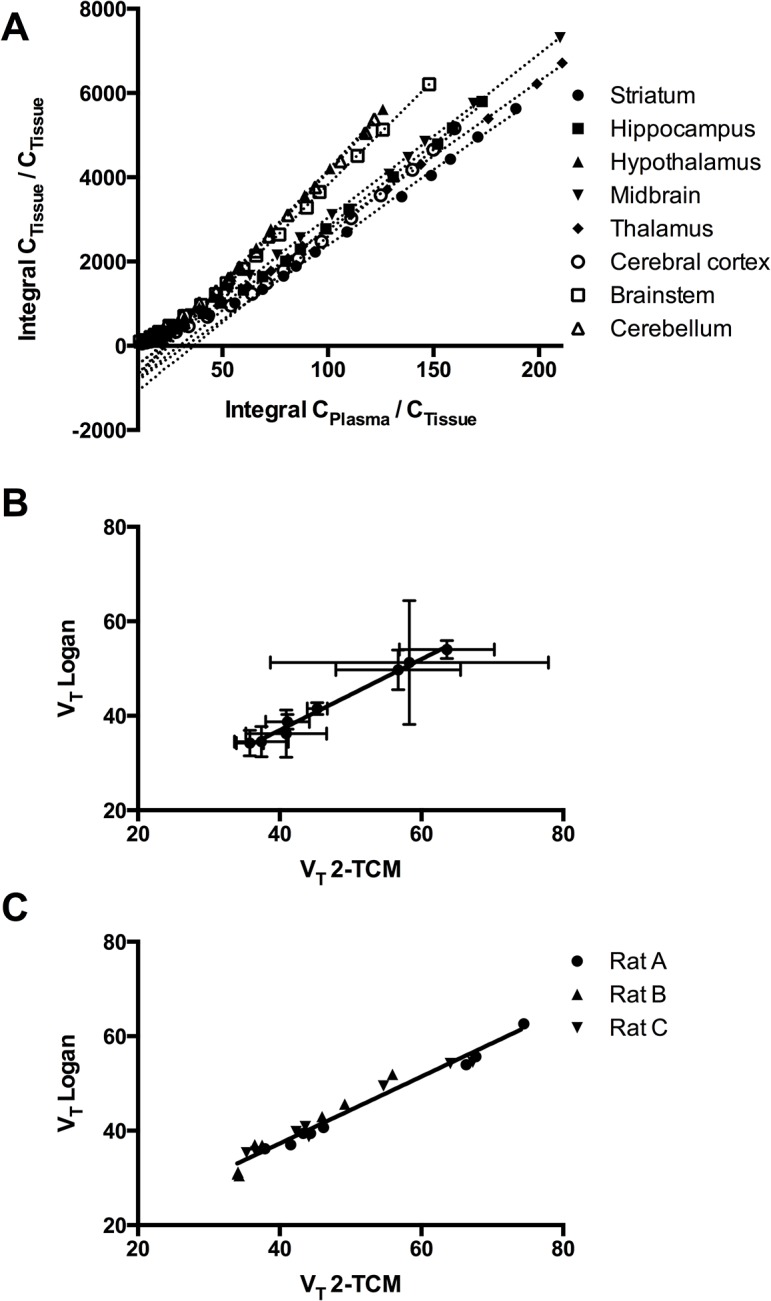
Fig 5. Correlation between VT obtained with two-tissue compartment modeling (2-TCM) and Logan analysis.

Logan plots (A) and the correlation between VT of [11C]PBR28 as calculated using 2-TCM and Logan graphical analysis [16], for the averages of eight brain regions (B) and for the individual values for each rats for the eight brain regions (C).
