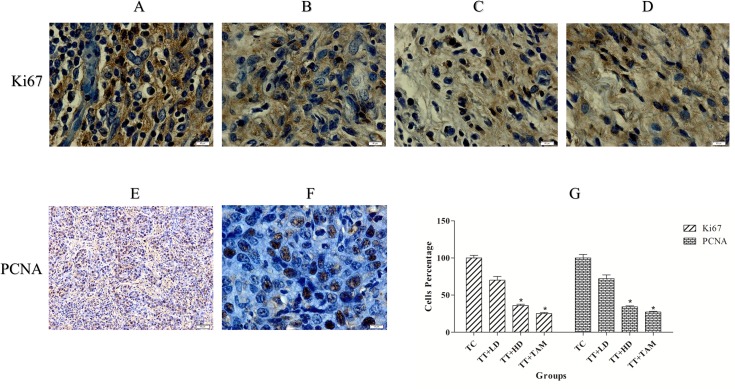
Fig 5. Immunohistochemical analysis of tumor proliferation markers.
Tumor control (Ki67, A), low-dose FALHE treatment (Ki67, B), high-dose FALHE treatment (Ki67, C), tamoxifen-treated (Ki67, D) and tumor control (PCNA, E and F). Brown particles irregular shapes indicating PCNA and Ki67 expression. The quantification of PCNA and Ki67 represent the reduction of tumor cells after treatment with low- and high-dose FALHE (G). The data are shown as the means ± SEM. Values are statistically significant at *P<0.05. Magnification, 100×. Magnification, 20× (E).

