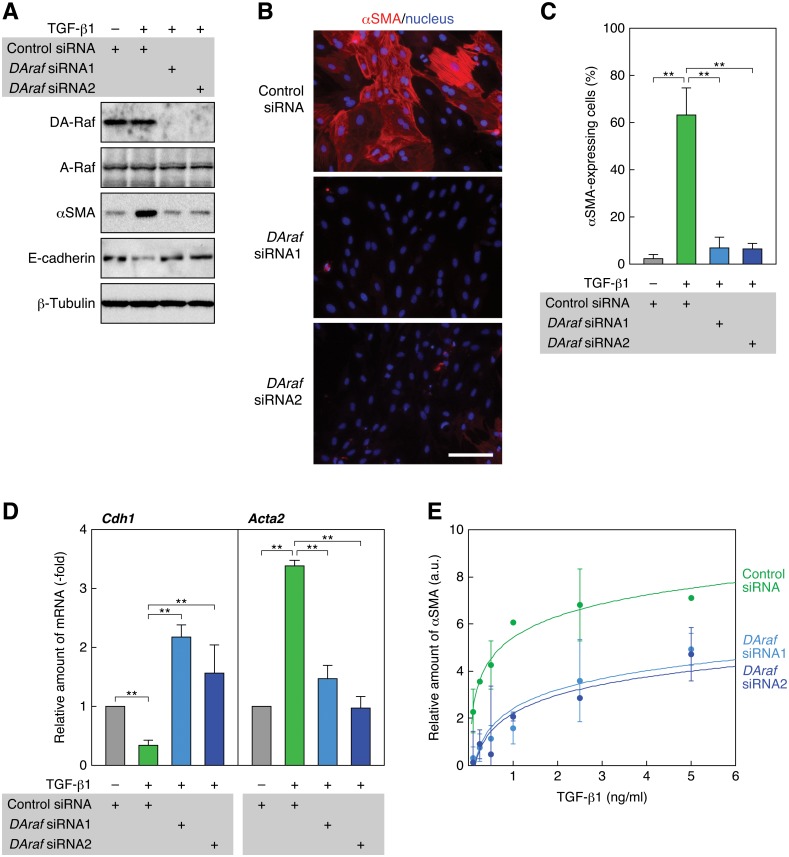
Fig 4. Knockdown of DA-Raf abrogates TGF-β1-induced EMT.
(A) Suppression of TGF-β1-induced αSMA expression by knockdown of DA-Raf with DAraf siRNAs. RLE cells were transfected with DAraf siRNAs as well as a control siRNA. Twenty-four hours after the transfection, they were treated with 0.5 ng/ml TGF-β1 for 48 h. The levels of DA-Raf, A-Raf, αSMA, and E-cadherin, as well as β-tubulin as a standard, were analyzed by immunoblotting. (B) Suppression of TGF-β1-induced αSMA expression with DAraf siRNAs. RLE cells were transfected with DAraf siRNAs and treated with 0.5 ng/ml TGF-β1. αSMA expression (red) and nuclei (blue) were detected by fluorescence microscopy. Scale bar, 50 μm. (C) The ratio of αSMA-expressing cells in the analysis of (B). The values are means ± SD of 3 independent experiments. **, P < 0.01 by t test. (D) Elevation of the TGF-β1-suppressed Cdh1 (E-cadherin) mRNA level and suppression of the TGF-β1-induced Acta2 (αSMA) mRNA level with DAraf siRNAs. RLE cells were transfected with DAraf siRNAs and treated with TGF-β1 for 48 h. Relative levels of Cdh1 and Acta2 mRNAs normalized to the Actb (β-actin) mRNA level were determined by real-time PCR. The values are means ± SD of 3 independent experiments. **, P < 0.01 by t test. (E) Dose-dependent induction of αSMA expression by TGF-β1 and its suppression by DAraf siRNAs. RLE cells were transfected with DAraf siRNAs and treated with 0.1–5 ng/ml TGF-β1 for 48 h. The intensities of αSMA and β-tubulin bands on immunoblots were analyzed by densitometry. The graph shows the ratio of αSMA to β-tubulin band intensity against TGF-β1 concentration. The values are means ± SD of 3 independent experiments. a.u., arbitrary units.

