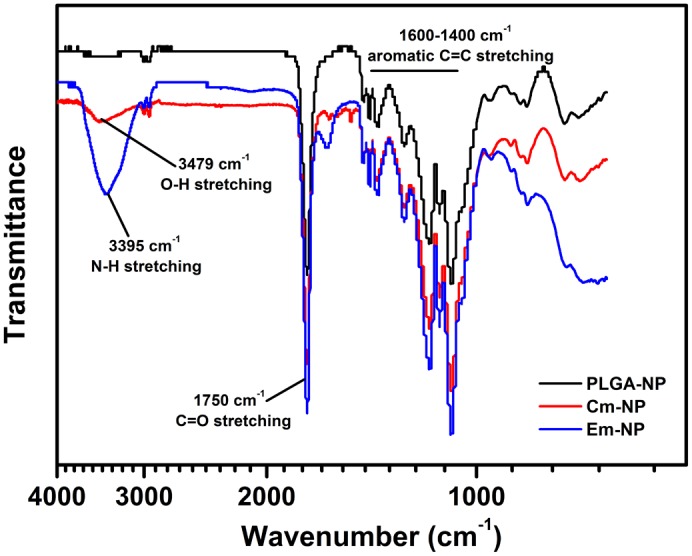
Fig 3. Fourier transformed infrared spectra of nanoparticles.

FTIR spectra of Cm-NPs (red), Em-NPs (blue) and free PLGA-NPs (black) showing overlapping peaks of C = O stretching, corresponding to PLGA. Distinct—OH and—NH stretching peaks characteristic of curcumin and emetine, respectively are also shown.
