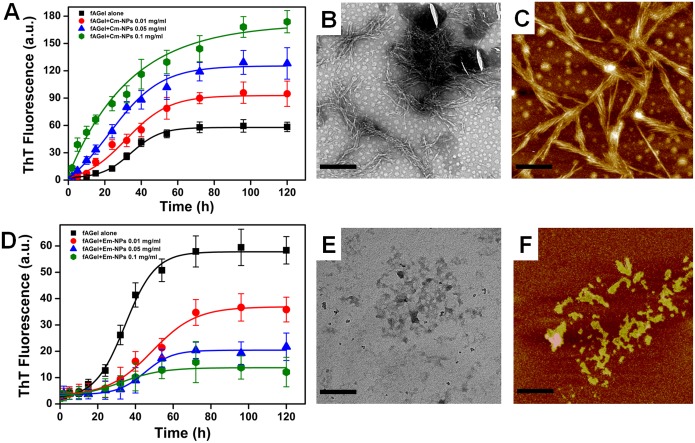
Fig 5. Kinetics and morphologies of NP- incubated fAGel aggregates.
fAGel aggregation kinetics monitored by ThT fluorescence in the absence (black trace) or in the presence (coloured traces) of different concentrations of NPs. (A) Acceleration of aggregation in the presence of increasing concentrations of Cm-NPs. The corresponding TEM (B) and AFM (C) images are shown. (D) Suppression of aggregation in the presence of increasing concentrations of Em-NPs with corresponding TEM (E) and AFM (F) images. In each case the TEM and the AFM images were taken after 24 h and 60 h of fAGel incubation with 0.1 mg/ml of respective NPs. Scale bars represent 500 nm for TEM and 200 nm for AFM images.

